Well, even for equal variances, if you have 2 groups with normal distribution and different means the combined residuals used for normality testing give significant Shapiro-Wilk result, as opposed to separate normality testing within groups.
example:
set.seed(555)
a <- rnorm(100, 10, 4)
as <- (a-mean(a))/sd(a)
b <- rnorm(100, 30, 4)
bs <- (b-mean(b))/sd(b)
X <- c(a,b)
Z <- c(as,bs)
group <- c(rep(1,100), rep(2,100))
abba <- data.frame(X,Z,group)
[RESOLVED] Normality assumption

Re: [RESOLVED] Normality assumption
Hi adaren,
Using the data you constructed, I find that the Shapiro-Wilk W statistic is always .99 (a near perfect fit to normality), and never approaches significance:
With your "X" values, this happens whether the normality test is done via jamovi's ANOVA analysis or via multiple (two) single-sample t tests.
A similar result occurs with your "Z" values--regardless of whether they're submitted to jamovi's ANOVA analysis or to a single sample t test.
ANOVA
ANOVA - X
------------------------------------------------------------------------
Sum of Squares df Mean Square F p
------------------------------------------------------------------------
group 19957 1 19957.30 1255 < .0001
Residuals 3150 198 15.91
------------------------------------------------------------------------
ASSUMPTION CHECKS
Normality Test (Shapiro-Wilk)
-----------------------------
Statistic p
-----------------------------
0.9946 0.6896
-----------------------------
ANOVA
ANOVA - Z
------------------------------------------------------------------------
Sum of Squares df Mean Square F p
------------------------------------------------------------------------
group 0.000 1 0.0000 0.000 1.0000
Residuals 198.000 198 1.0000
------------------------------------------------------------------------
ASSUMPTION CHECKS
Normality Test (Shapiro-Wilk)
-----------------------------
Statistic p
-----------------------------
0.9949 0.7381
-----------------------------
ONE SAMPLE T-TEST
One Sample T-Test
-----------------------------------------------------
Statistic df p
-----------------------------------------------------
Z Student's t -2.240e-15 199.0 1.0000
-----------------------------------------------------
Note. H<U+2090> µ <U+2260> 0
Normality Test (Shapiro-Wilk)
-----------------------------
W p
-----------------------------
Z 0.9949 0.7381
-----------------------------
Note. A low p-value
suggests a violation of
the assumption of
normality
ONE SAMPLE T-TEST
One Sample T-Test
----------------------------------------------------------------
Statistic df p
----------------------------------------------------------------
X_Group1Only Student's t 26.11 99.00 < .0001
----------------------------------------------------------------
Note. H<U+2090> µ <U+2260> 0
Normality Test (Shapiro-Wilk)
------------------------------------
W p
------------------------------------
X_Group1Only 0.9914 0.7763
------------------------------------
Note. A low p-value suggests a
violation of the assumption of
normality
ONE SAMPLE T-TEST
One Sample T-Test
----------------------------------------------------------------
Statistic df p
----------------------------------------------------------------
X_Group2Only Student's t 73.28 99.00 < .0001
----------------------------------------------------------------
Note. H<U+2090> µ <U+2260> 0
Normality Test (Shapiro-Wilk)
------------------------------------
W p
------------------------------------
X_Group2Only 0.9852 0.3277
------------------------------------
Note. A low p-value suggests a
violation of the assumption of
normality
Using the data you constructed, I find that the Shapiro-Wilk W statistic is always .99 (a near perfect fit to normality), and never approaches significance:
With your "X" values, this happens whether the normality test is done via jamovi's ANOVA analysis or via multiple (two) single-sample t tests.
A similar result occurs with your "Z" values--regardless of whether they're submitted to jamovi's ANOVA analysis or to a single sample t test.
Code: Select all
set.seed(555)
a <- rnorm(100, 10, 4)
as <- (a-mean(a))/sd(a)
b <- rnorm(100, 30, 4)
bs <- (b-mean(b))/sd(b)
X <- c(a,b)
Z <- c(as,bs)

X_Group1Only <- c(a,rep(NA,100))
X_Group2Only <- c(rep(NA,100),b)
Z_Group1Only <- c(as,rep(NA,100))
Z_Group2Only <- c(rep(NA,100),bs)


group <- as.character(c(rep(1,100), rep(2,100)))
abba <- data.frame(X,X_Group1Only,X_Group2Only,Z_Group1Only,Z_Group2Only,Z,group)
data <- abba #data <- cbind(data,abba)


jmv::ANOVA(
    formula = X ~ group,
    data = data,
    norm = TRUE)

jmv::ANOVA(
    formula = Z ~ group,
    data = data,
    norm = TRUE)

jmv::ttestOneS(
    data = data,
    vars = Z,
    norm = TRUE)

jmv::ttestOneS(
    data = data,
    vars = X_Group1Only,
    norm = TRUE)

jmv::ttestOneS(
    data = data,
    vars = X_Group2Only,
    norm = TRUE)
ANOVA - X
------------------------------------------------------------------------
Sum of Squares df Mean Square F p
------------------------------------------------------------------------
group 19957 1 19957.30 1255 < .0001
Residuals 3150 198 15.91
------------------------------------------------------------------------
ASSUMPTION CHECKS
Normality Test (Shapiro-Wilk)
-----------------------------
Statistic p
-----------------------------
0.9946 0.6896
-----------------------------
ANOVA
ANOVA - Z
------------------------------------------------------------------------
Sum of Squares df Mean Square F p
------------------------------------------------------------------------
group 0.000 1 0.0000 0.000 1.0000
Residuals 198.000 198 1.0000
------------------------------------------------------------------------
ASSUMPTION CHECKS
Normality Test (Shapiro-Wilk)
-----------------------------
Statistic p
-----------------------------
0.9949 0.7381
-----------------------------
ONE SAMPLE T-TEST
One Sample T-Test
-----------------------------------------------------
Statistic df p
-----------------------------------------------------
Z Student's t -2.240e-15 199.0 1.0000
-----------------------------------------------------
Note. H<U+2090> µ <U+2260> 0
Normality Test (Shapiro-Wilk)
-----------------------------
W p
-----------------------------
Z 0.9949 0.7381
-----------------------------
Note. A low p-value
suggests a violation of
the assumption of
normality
ONE SAMPLE T-TEST
One Sample T-Test
----------------------------------------------------------------
Statistic df p
----------------------------------------------------------------
X_Group1Only Student's t 26.11 99.00 < .0001
----------------------------------------------------------------
Note. H<U+2090> µ <U+2260> 0
Normality Test (Shapiro-Wilk)
------------------------------------
W p
------------------------------------
X_Group1Only 0.9914 0.7763
------------------------------------
Note. A low p-value suggests a
violation of the assumption of
normality
ONE SAMPLE T-TEST
One Sample T-Test
----------------------------------------------------------------
Statistic df p
----------------------------------------------------------------
X_Group2Only Student's t 73.28 99.00 < .0001
----------------------------------------------------------------
Note. H<U+2090> µ <U+2260> 0
Normality Test (Shapiro-Wilk)
------------------------------------
W p
------------------------------------
X_Group2Only 0.9852 0.3277
------------------------------------
Note. A low p-value suggests a
violation of the assumption of
normality
Re: [RESOLVED] Normality assumption
[revisiting] Agreed, my mistake here, these are non-significant.
Still the case for two groups with normal distributions but different variances and means is problematic: it gives a significant result of Shapiro-Wilk if done under T-tests / Assumption checks as opposed to the non-significant using basic method of testing each group separately (as in Exploration>descriptives when split by group).
This seems like an inferior testing method is selected for Assumption Checks...

Re: [RESOLVED] Normality assumption
hi,
my experience of talking to stats folks, and people who teach stats, etc. is that most people want the normality tests to be performed on the residuals combined. there are a minority of folks who want the normality tests done separately for each group.
the shapiro-wilk under descriptives was added primarily to accommodate this latter group.
cheers
Re: [RESOLVED] Normality assumption
@adaran
I find that for your data, the Shapiro-Wilk test result is always *non*-significant, regardless of whether it is or is not conducted using "Exploration >> Descriptives >> Split-by-group."
However, the Shapiro Wilk and all other significance-tests of assumptions are problematic because, like any significance test, it is almost guaranteed to turn out non-significant if the sample size is small enough. When you do a separate Shapiro-Wilk test for each of the two groups, you cut your sample size in half and thus have less power to detect non-normality (compared to a procedure in which you include the residuals for the entire group1-plus-group2 sample). So you should expect to find significant non-normality more often when you conduct a separate test for each group. I don't think that implies that the separate-test-for-each-group approach is better.
In my opinion, the Shapiro-Wilk test would be more useful if it provided an effect size instead of a p value, since effect sizes aren't systematically sensitive to sample size. Thus, the assessment of adherence to the normality assumption would involve assessing the effect size for the Shapiro-Wilk result.
In the absence of a Shapiro-Wilk effect size, one can get similar information by generating and inspecting a QQ plot (jamovi provides QQ plots).
I find that for your data, the Shapiro-Wilk test result is always *non*-significant, regardless of whether it is or is not conducted using "Exploration >> Descriptives >> Split-by-group."
- Untitled444.png (23.46 KiB) Viewed 99514 times
However, the Shapiro Wilk and all other significance-tests of assumptions are problematic because, like any significance test, it is almost guaranteed to turn out non-significant if the sample size is small enough. When you do a separate Shapiro-Wilk test for each of the two groups, you cut your sample size in half and thus have less power to detect non-normality (compared to a procedure in which you include the residuals for the entire group1-plus-group2 sample). So you should expect to find significant non-normality more often when you conduct a separate test for each group. I don't think that implies that the separate-test-for-each-group approach is better.
In my opinion, the Shapiro-Wilk test would be more useful if it provided an effect size instead of a p value, since effect sizes aren't systematically sensitive to sample size. Thus, the assessment of adherence to the normality assumption would involve assessing the effect size for the Shapiro-Wilk result.
In the absence of a Shapiro-Wilk effect size, one can get similar information by generating and inspecting a QQ plot (jamovi provides QQ plots).
Re: [RESOLVED] Normality assumption
Notwithstanding my points, above, there does seem to be something wrong with the implementation of Shapiro-Wilk with regard to the Independent Samples t test": In that implementation, the Shapiro-Wilk statistic and its p value change radically as the variance of Group B (i.e., variance.b) changes relative to the variance of Group A. This should not happen, since it make the Shapiro-Wilk statistic sensitive it unequal variance--not just non-normality. Note that, of course, the unequal variances have no effect on Shapiro-Wilk when calculated separately for each of the two groups.
- Attachments
-
- Shapiro-Wilk jamovi forum.zip
- (10.78 KiB) Downloaded 4689 times
Re: [RESOLVED] Normality assumption
@jonathon
fair enough, thanks for clearing this for me
@reason180
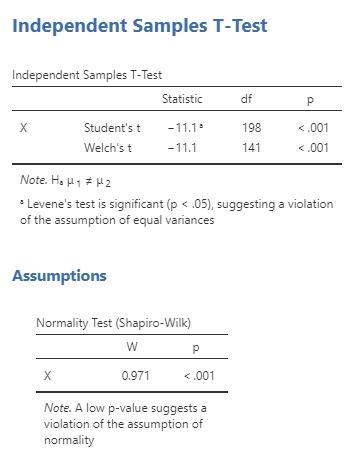
I meant the first example, with different variances, where I get significant Shapiro-Wilk:

Agreed, the size matters. Nonetheless, the groups tested here are quite sizeable, enough to forget about the normality check altogether due to Central Limit Theorem. QQ plot is also departing from normal.
And by better I mean that two groups may come from normal populations with different means and different variances, still normal though - as in the example - so we would expect, that normality should be confirmed, and Welch's test should be the one to go to for the result (but this is not the case with Shapiro-Wilk significant within the T-test module).
fair enough, thanks for clearing this for me
@reason180
I meant the first example, with different variances, where I get significant Shapiro-Wilk:
Agreed, the size matters. Nonetheless, the groups tested here are quite sizeable, enough to forget about the normality check altogether due to Central Limit Theorem. QQ plot is also departing from normal.
And by better I mean that two groups may come from normal populations with different means and different variances, still normal though - as in the example - so we would expect, that normality should be confirmed, and Welch's test should be the one to go to for the result (but this is not the case with Shapiro-Wilk significant within the T-test module).
Re: [RESOLVED] Normality assumption
hopefully this link works
https://i.postimg.cc/C1G4j7Pj/test.jpg
https://i.postimg.cc/C1G4j7Pj/test.jpg
Re: [RESOLVED] Normality assumption
FYI. I see that if the t test is conducted on Z scores (standardized separately for each of the two means), the Shapiro-Wilk output is correct and is not impacted by unequal variances. I think that the algorithm should be adjusted so that, in the context of a t test, Shapiro-Wilk is conducted on the Z scores (which some people might call "standardized model-residuals."
- Attachments
-
- Shapiro-Wilk on Z scores jamovi forum.zip
- (10.8 KiB) Downloaded 3951 times
Re: [RESOLVED] Normality assumption
That's true, Z-scores calculated for two groups separately eliminate the difference in variances which is present in raw scores and is the source of trouble.