I made a module to plot Likert scaled variables using Larmarange's R package ggstats. The module is available at https://github.com/vjalby/vijLikert (the built module is for Apple Silicon).
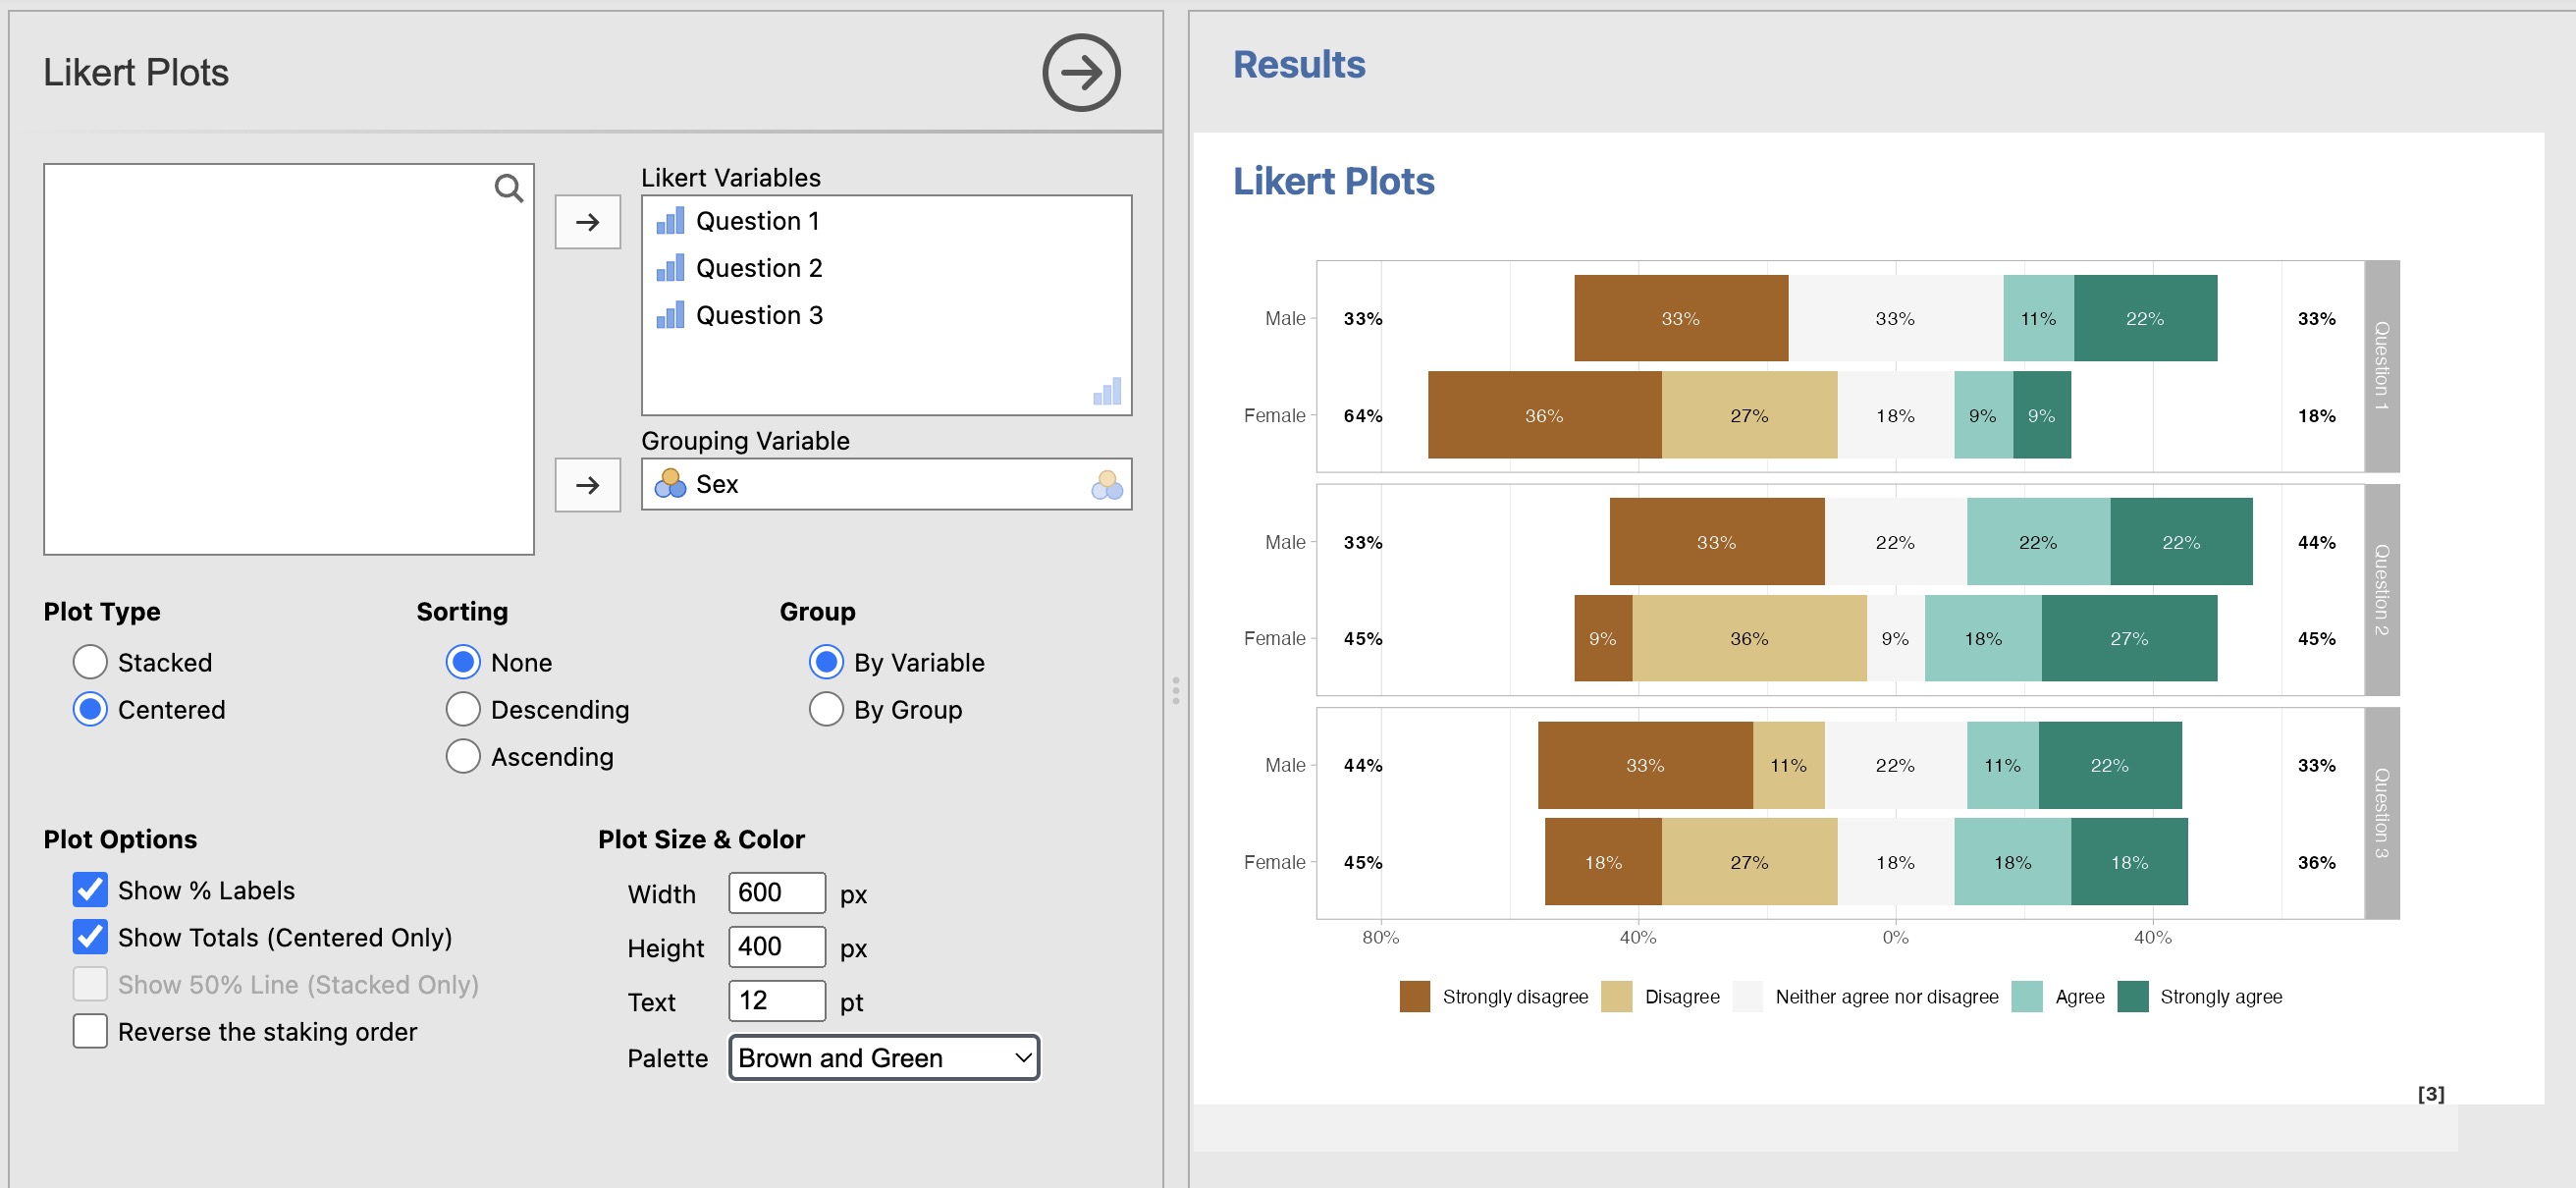
Here a screenshot
A sample file is included under Open > Data Library.
1. Questions regarding the module (to @vjalbi) a) When my item questions are quite long (because I want to cite them in full rather than just using “Question1” as shown in your screenshots), they get cut off in the output. Is there any way to improve or adjust this?
b) Are there any short-term plans to include descriptive tables and group comparison options directly within your module—so that it’s not only a plotting module, but also an analysis tool?
2. General questions on describing and analyzing Likert data I’m new to analyzing Likert-scale data and unsure how to handle it for descriptive and comparative purposes. Some treat it as ordinal, others as interval/scale data.
a) What are appropriate ways to describe Likert items?
• Means and standard deviations?
• Percentages per response category?
• Something else?
b) How should I analyze group differences for Likert items?
• Are t-tests or ANOVAs acceptable?
• Or should I use non-parametric methods like Mann–Whitney U?
3. Exploratory Factor Analysis (EFA) If I perform an exploratory factor analysis on a group of Likert items and discover that they load onto multiple factors,
• does that mean I should not compute a single composite (mean) score across all items for each person?
• Should I instead compute separate mean scores per factor?
• Or is it still justifiable to use an overall mean score under certain conditions (e.g., high internal consistency, conceptual justification)?
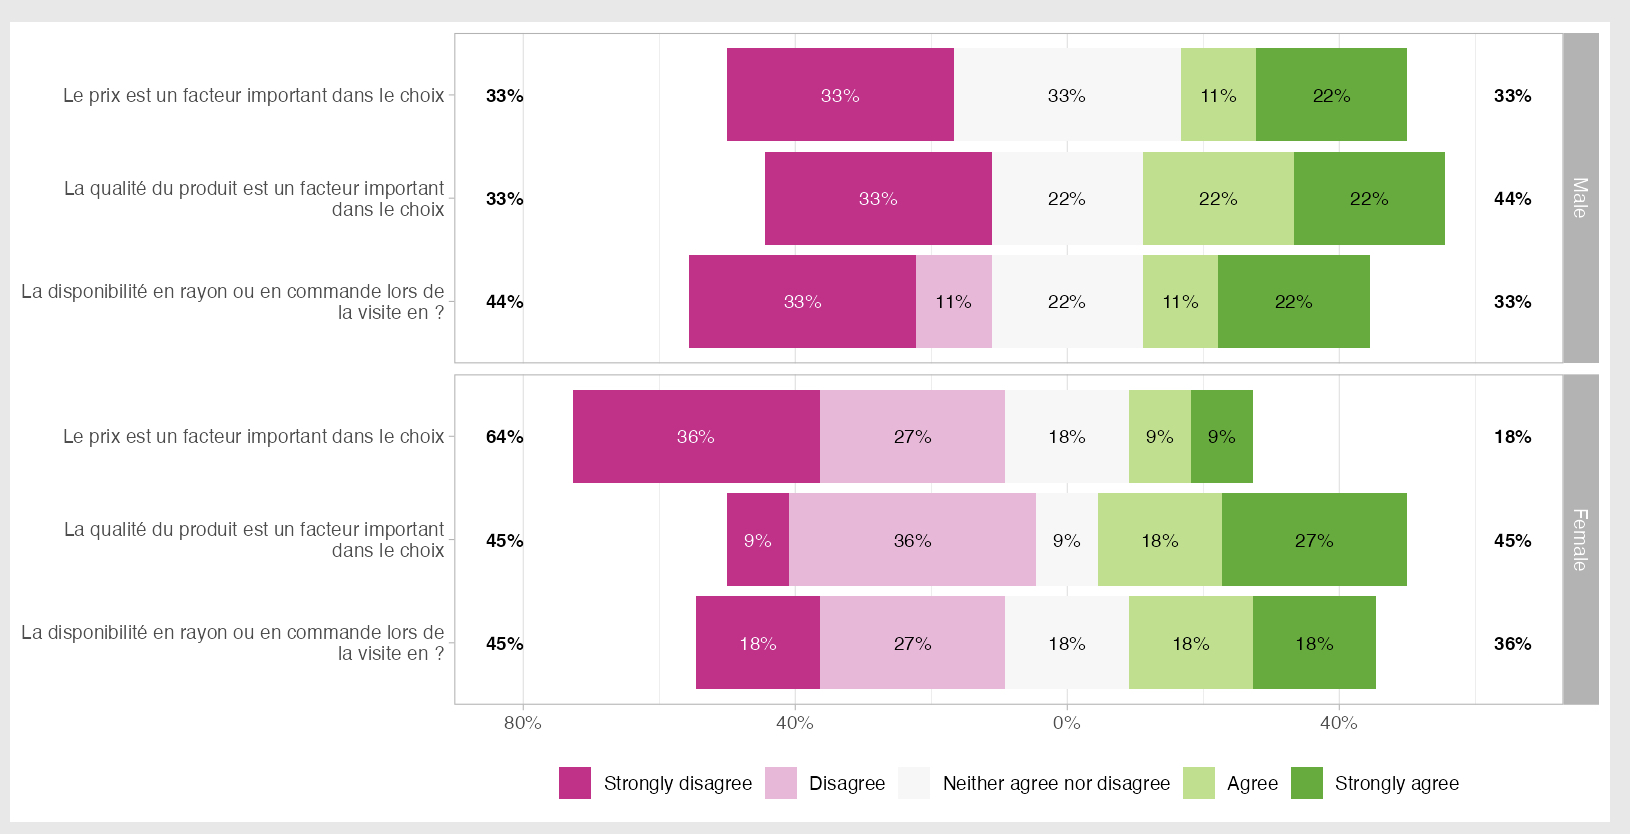
1a) if you group "by group", the whole variable name is displayed :
Not sure it makes sense when grouping "by variable"
1b) I may. Tell me what you expect by PM.
2+3) https://www.mdpi.com/2673-8392/5/1/18 may be a good start. To be concise, one Likert variable should be considered as an ordinal variable : use percentages and/or median and/or non-parametric methods ; Likert scale (= 4 or more Likert variables combined -- sum or factor) may be considered as a continuous variables. See also Jamovi factor > Reliability Analysis.
Hi! I'm using Jamovi 2.7.17.0 and I installed the module from Github and I receive a message saying that "Installed version must be updated" How can I solve this? Thanks in advance