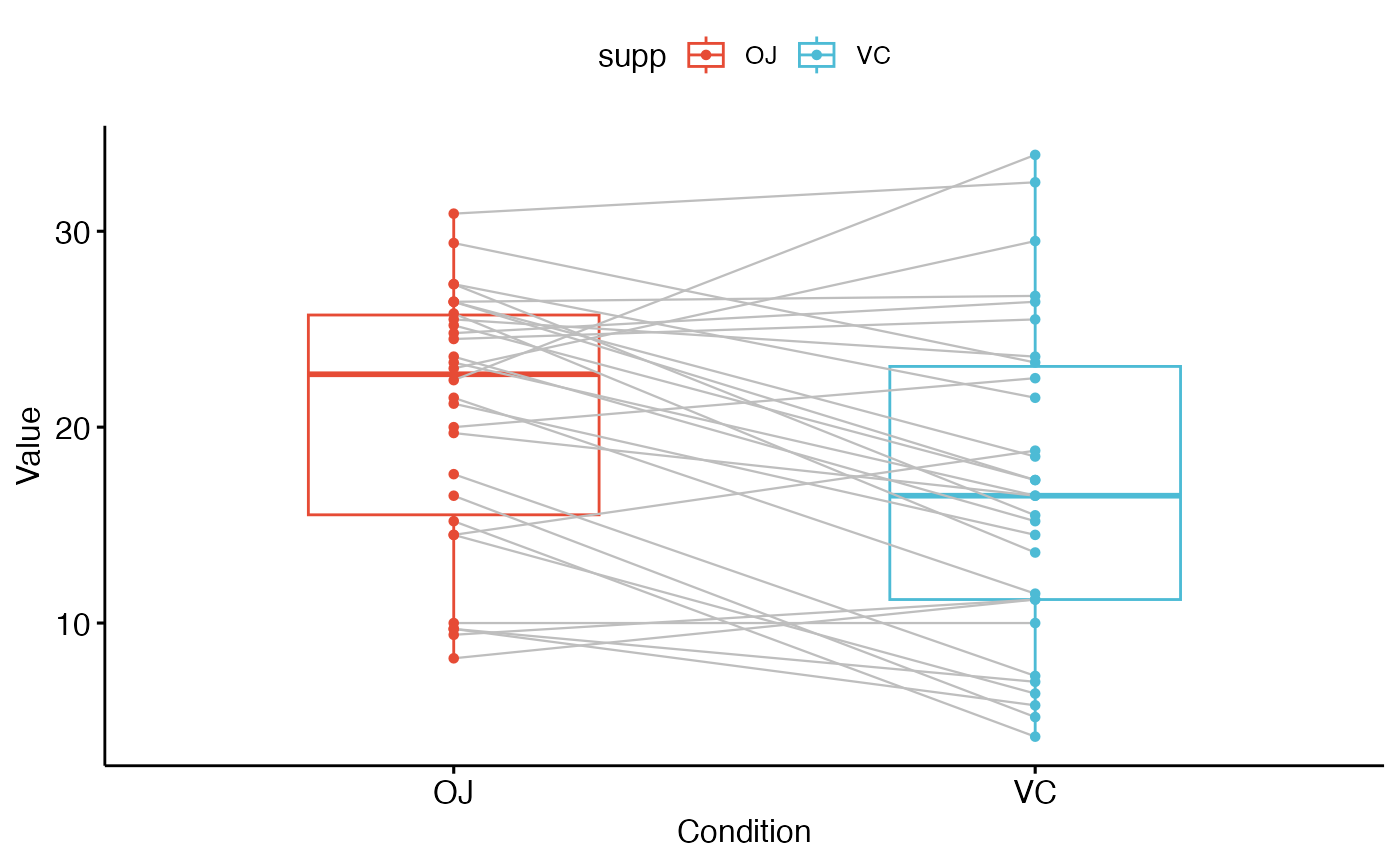
I'm using jamovi for undergrad teaching and I'd really like students to spend more time looking at individual data rather than just group means. One thing that I'd really love is for a simple (enough) way for people to visualise paired data or construct spaghetti plots of longitudinal data. Something like this - does anyone have any suggestions? Would really appreciate it!
 - does anyone have any suggestions? Would really appreciate it!