Hi adaren,
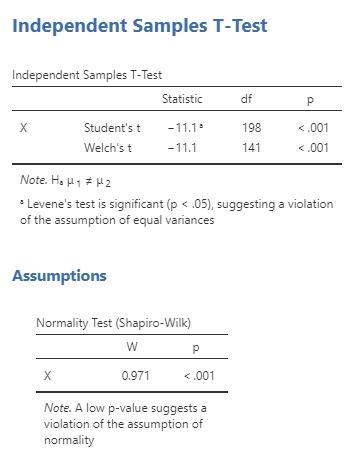
Using the data you constructed, I find that the Shapiro-Wilk W statistic is always .99 (a near perfect fit to normality), and never approaches significance:
With your "X" values, this happens whether the normality test is done via jamovi's ANOVA analysis or via multiple (two) single-sample t tests.
A similar result occurs with your "Z" values--regardless of whether they're submitted to jamovi's ANOVA analysis or to a single sample t test.
Code: Select all
set.seed(555)
a <- rnorm(100, 10, 4)
as <- (a-mean(a))/sd(a)
b <- rnorm(100, 30, 4)
bs <- (b-mean(b))/sd(b)
X <- c(a,b)
Z <- c(as,bs)

X_Group1Only <- c(a,rep(NA,100))
X_Group2Only <- c(rep(NA,100),b)
Z_Group1Only <- c(as,rep(NA,100))
Z_Group2Only <- c(rep(NA,100),bs)


group <- as.character(c(rep(1,100), rep(2,100)))
abba <- data.frame(X,X_Group1Only,X_Group2Only,Z_Group1Only,Z_Group2Only,Z,group)
data <- abba #data <- cbind(data,abba)


jmv::ANOVA(
    formula = X ~ group,
    data = data,
    norm = TRUE)

jmv::ANOVA(
    formula = Z ~ group,
    data = data,
    norm = TRUE)

jmv::ttestOneS(
    data = data,
    vars = Z,
    norm = TRUE)

jmv::ttestOneS(
    data = data,
    vars = X_Group1Only,
    norm = TRUE)

jmv::ttestOneS(
    data = data,
    vars = X_Group2Only,
    norm = TRUE)
ANOVA
ANOVA - X
------------------------------------------------------------------------
Sum of Squares df Mean Square F p
------------------------------------------------------------------------
group 19957 1 19957.30 1255 < .0001
Residuals 3150 198 15.91
------------------------------------------------------------------------
ASSUMPTION CHECKS
Normality Test (Shapiro-Wilk)
-----------------------------
Statistic p
-----------------------------
0.9946 0.6896
-----------------------------
ANOVA
ANOVA - Z
------------------------------------------------------------------------
Sum of Squares df Mean Square F p
------------------------------------------------------------------------
group 0.000 1 0.0000 0.000 1.0000
Residuals 198.000 198 1.0000
------------------------------------------------------------------------
ASSUMPTION CHECKS
Normality Test (Shapiro-Wilk)
-----------------------------
Statistic p
-----------------------------
0.9949 0.7381
-----------------------------
ONE SAMPLE T-TEST
One Sample T-Test
-----------------------------------------------------
Statistic df p
-----------------------------------------------------
Z Student's t -2.240e-15 199.0 1.0000
-----------------------------------------------------
Note. H<U+2090> µ <U+2260> 0
Normality Test (Shapiro-Wilk)
-----------------------------
W p
-----------------------------
Z 0.9949 0.7381
-----------------------------
Note. A low p-value
suggests a violation of
the assumption of
normality
ONE SAMPLE T-TEST
One Sample T-Test
----------------------------------------------------------------
Statistic df p
----------------------------------------------------------------
X_Group1Only Student's t 26.11 99.00 < .0001
----------------------------------------------------------------
Note. H<U+2090> µ <U+2260> 0
Normality Test (Shapiro-Wilk)
------------------------------------
W p
------------------------------------
X_Group1Only 0.9914 0.7763
------------------------------------
Note. A low p-value suggests a
violation of the assumption of
normality
ONE SAMPLE T-TEST
One Sample T-Test
----------------------------------------------------------------
Statistic df p
----------------------------------------------------------------
X_Group2Only Student's t 73.28 99.00 < .0001
----------------------------------------------------------------
Note. H<U+2090> µ <U+2260> 0
Normality Test (Shapiro-Wilk)
------------------------------------
W p
------------------------------------
X_Group2Only 0.9852 0.3277
------------------------------------
Note. A low p-value suggests a
violation of the assumption of
normality