Page 1 of 1
Stacked Box Plots not possible
Posted: Sun Dec 22, 2019 11:15 pm
by Lina
Hello,
I have a problem with the box plot function. I want to create several box plots in one graphic, which doesn't seem possible with my data. I have the data for my 3 variables (forgetting test, forgetting restudy, forgetting jol) and can get seperate plots for each one, but not one for all in the same graphic. Do I have to create a 4th predictive variable "forgetting group" (the groups being test, restudy, jol)? If yes, how do I do that?
Thanks in advance and happy xmas days! Lina
Re: Stacked Box Plots not possible
Posted: Sun Dec 22, 2019 11:21 pm
by jonathon
hi lina,
yes, if you want the 3 in the same graphic, you'll need to convert them to long format (one column for the values, and one column for the group). the easiest way to do that is simply to copy/paste the values into a new column.
cheers
jonathon
Re: Stacked Box Plots not possible
Posted: Sun Dec 22, 2019 11:36 pm
by Lina
Deleted
Re: Stacked Box Plots not possible
Posted: Sun Dec 22, 2019 11:43 pm
by Lina
jonathon wrote:hi lina,
yes, if you want the 3 in the same graphic, you'll need to convert them to long format (one column for the values, and one column for the group). the easiest way to do that is simply to copy/paste the values into a new column.
cheers
jonathon
At the risk of sounding stupid : I still don't know how to do that. If I copy the data into new columns, I still have the same problem (only with slightly different variable names). This is my first time using jamovi so I'm really at a loss here...how do I create the group and how do I connect it to the 3 data sets?
Re: Stacked Box Plots not possible
Posted: Mon Dec 23, 2019 12:32 am
by jonathon
hey, no worries.
so in the first screenshot (below) i've got the variables A, B, C ... data in what we call 'wide format' ... i believe this is the format your data is in. i've created two more columns 'value' and 'group' and this is the same data rearranged into 'long format'. this is how you want to rearrange your data.
in the second screenshot you can see that i'm requesting box plots of 'value', and grouping by 'group'. does this do what you need? makes sense?
kind regards
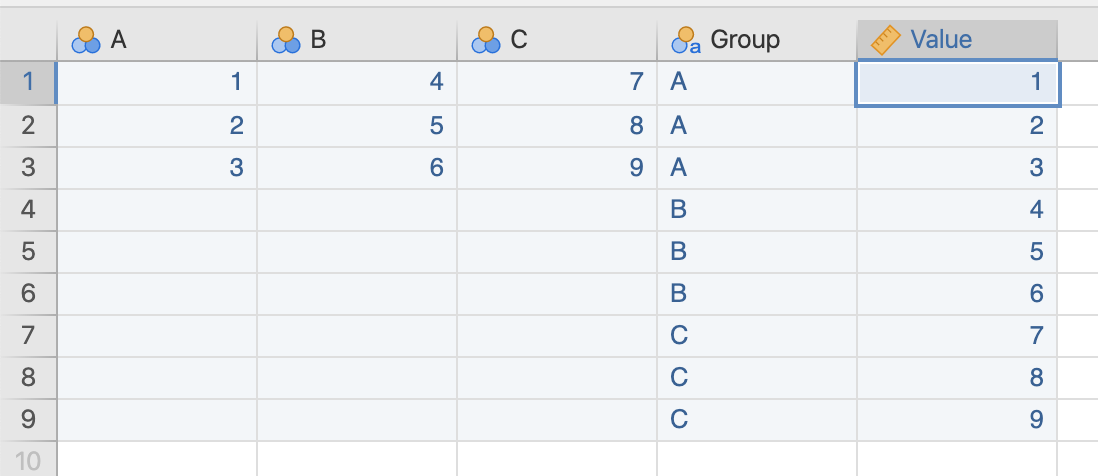
- Screen Shot 2019-12-23 at 11.28.03.png (55.23 KiB) Viewed 4347 times
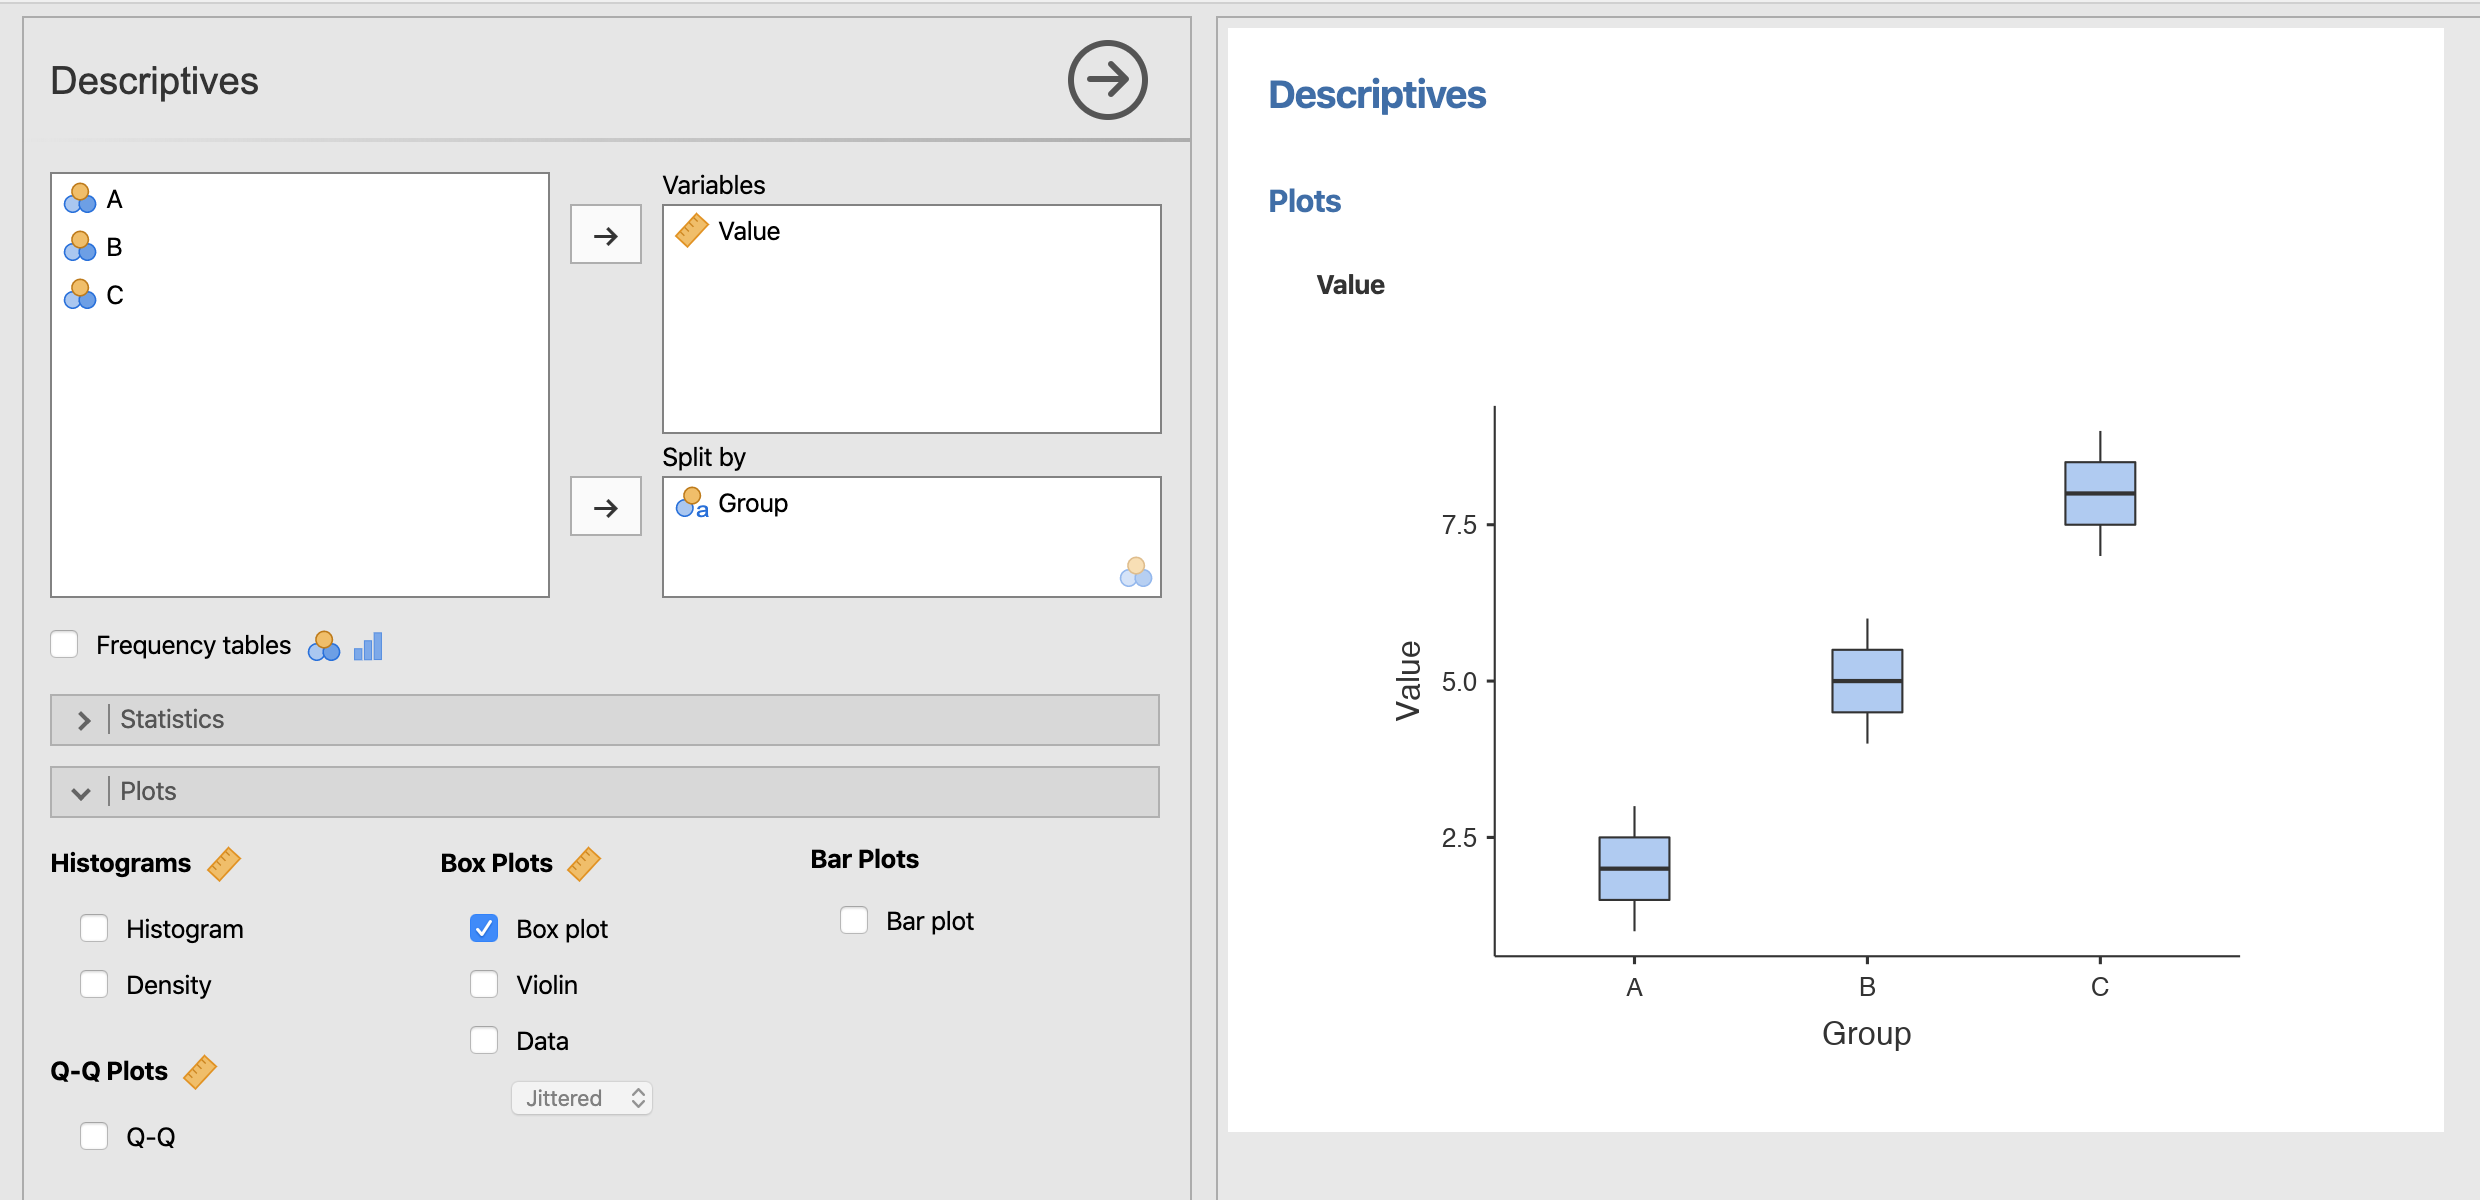
- Screen Shot 2019-12-23 at 11.28.21.png (182.05 KiB) Viewed 4347 times
Re: Stacked Box Plots not possible
Posted: Mon Dec 23, 2019 12:32 am
by Lina
jonathon wrote:hi lina,
yes, if you want the 3 in the same graphic, you'll need to convert them to long format (one column for the values, and one column for the group). the easiest way to do that is simply to copy/paste the values into a new column.
cheers
jonathon
Aaaah, ok, got it now!!! Thank you so much.