Page 1 of 1
Rj editor ggpot2 missing error bars
Posted: Tue Jul 06, 2021 9:23 pm
by bobk
I'm trying to set up examples for my students (who are using jamovi in our stat classes) for doing simple plots using the Rj editor, that aren't that easy or editable in jamovi. I've run into a ggplot2 issue. I can generate a bar plot, but not the error bars. I checked, and the code works fine in R. Three variables representing names of apes (apes), average score for each group (score), and standard error (se) for the error bars. Again, works in R.
Code: Select all
# simple bar graph in jamovi
library(ggplot2)
ggplot(data, aes(x = apes, y = score)) +
  geom_col() +
  geom_col(fill = "lightblue", colour = "black") +
  geom_errorbar(aes(ymin = score - se, ymax = score + se), width = .3)
Any help appreciated.
.
Re: Rj editor ggpot2 missing error bars
Posted: Tue Jul 06, 2021 11:25 pm
by bobk
Never mind; the se variable was set as "nominal". R (I think) doesn't type this way, but jamovi does. Leaving this here for other (like me) semi-clueless members.

.
Re: Rj editor ggpot2 missing error bars
Posted: Wed Jul 07, 2021 1:38 pm
by MAgojam
Hi, @bobk.
Do you think the following code that I suggest for use with Rj could be useful to you?
Code: Select all
# ------------------------------------------------------------------- #
# Function to calculate:
# Mean and standard error for each group
#
# my_df    : data frame
# gr_names : vector of column names to be used as grouping variables
# vr_name  : name of a column containing the variable to be summariezed
#
data_summary <- function(my_df, gr_names, vr_name) {
    summary_func <- function(x, col) {
        c(mean = mean(x[[col]], na.rm = TRUE),
          sd   = sd(x[[col]],   na.rm = TRUE),
          se   = sd(x[[col]],   na.rm = TRUE)/sqrt(length(x[[col]]))
          )
    }
    d_sum <-plyr::ddply(my_df,
                        gr_names,
                        .fun = summary_func,
                        vr_name)
    return(d_sum)
}
# ------------------------------------------------------------------- #


df_data <- data_summary(my_df = data,
                        gr_names = c("apes"),
                        vr_name  = "score")
head(df_data)


# simple bar graph in jamovi
p <- ggplot(df_data,
            aes(x      = apes,
                y      = mean)) +
     geom_bar(stat     = "identity",
              fill     = "lightblue",
              color    = "black",
              position = position_dodge())

# sd (error bars)
p + geom_errorbar(aes(ymin     = mean - sd,
                      ymax     = mean + sd),
                      width    = .2,
                      position = position_dodge(.9))

# se (error bars)
p + geom_errorbar(aes(ymin     = mean - se,
                      ymax     = mean + se),
                      width    = .2,
                      position = position_dodge(.9))
Also take a look at the attached screenshot to see an example of some data.
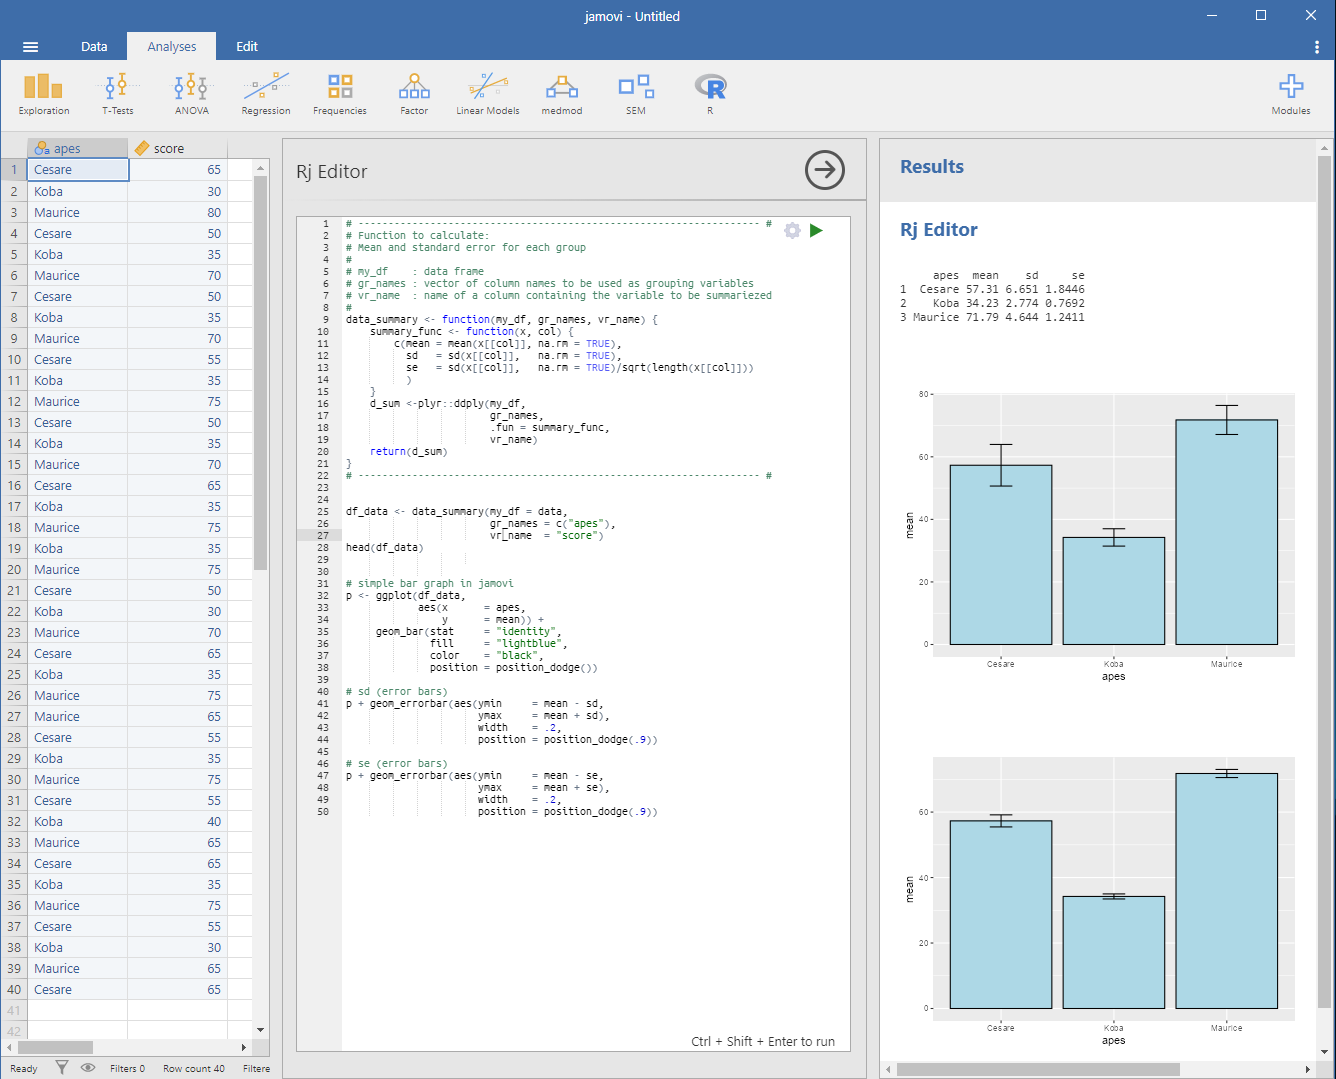
- se_error_bars.png (132.06 KiB) Viewed 5127 times
Cheers,
Maurizio