Hey Isabel,
I'll give you a small R script to use with the Rj module that you find in the jamovi library, if you don't already know it.
Code: Select all
df <- data[]

# Replace with your column name
mycolname <- "HQ_03"


library(dplyr)
library(stringr)

# Function to count all words and calculate percentages and cumulative percentages
countws <- function(data, colws) {
  # Check if colws exists in data
  if (!colws %in% names(data)) {
    stop(paste("Column", colws, "does not exist in the data frame"))
  }

  # Split words into a list of vectors
  wsep <- unlist(strsplit(as.character(data[[colws]]), ","))

  # Count occurrences of each word
  nws <- table(wsep)

  # Calculate total number of words
  totws <- sum(nws)

  # Calculate percentage of each word
  percws <- (nws / totws) * 100

  # Create a data frame with the results
  resdf <- data.frame(
    words = names(nws),
    counts = as.integer(nws),
    perc = as.numeric(percws)
  )

  # Sort the data frame by counts in descending order
  resdf <- resdf %>% arrange(desc(counts))

  # Calculate cumulative percentage
  resdf$cum_perc <- cumsum(resdf$perc)

  # Return the results along with column name for header
  return(list(data = resdf, colname = colws))
}

# Use the function to count all words and calculate percentages and cumulative percentages
result <- countws(data = df, colws = mycolname)
result_df <- result$data
colname <- result$colname

# Format the percentage and cumulative percentage with two decimal places
result_df$perc <- sprintf("%.2f%%", result_df$perc)
result_df$cum_perc <- sprintf("%.2f%%", result_df$cum_perc)

# Define column widths
word_width <- 20
count_width <- 12
perc_width <- 12
cum_perc_width <- 16

# Create header with actual column name
header <- sprintf("%-*s %*s %*s %*s",
                   word_width, colname,
                   count_width, "Counts",
                   perc_width, "% of Total",
                   cum_perc_width, "Cumulative %")

# Calculate the total length of the line
line_length <- nchar(header)

# Create a line of dashes based on the total length
line <- strrep("-", line_length)

# Function to print the results with controlled spacing
print_results <- function(df) {
  # Print the top line
  cat(line, "\n")

  # Print header
  cat(header, "\n")

  # Print the single line of dashes below the header
  cat(line, "\n")

  # Print each row
  for (i in 1:nrow(df)) {
    # Print each value with correct alignment, including the percent sign
    cat(sprintf("%-*s %*d %*s %*s\n",
                word_width, str_pad(df$words[i], width = word_width, side = "right"),
                count_width, df$counts[i],
                perc_width, df$perc[i],
                cum_perc_width, df$cum_perc[i]))
  }

  # Print the bottom line
  cat(line, "\n")
}

# Call the print function
print_results(result_df)
It's my possible answer to your question, which could also be useful to others.
It could probably be accessible differently in the future, but for now you can copy the code that I leave and paste it into the Rj text editor.
Running it should give you what you're looking for.
The screenshot that I attach should clarify what it does.
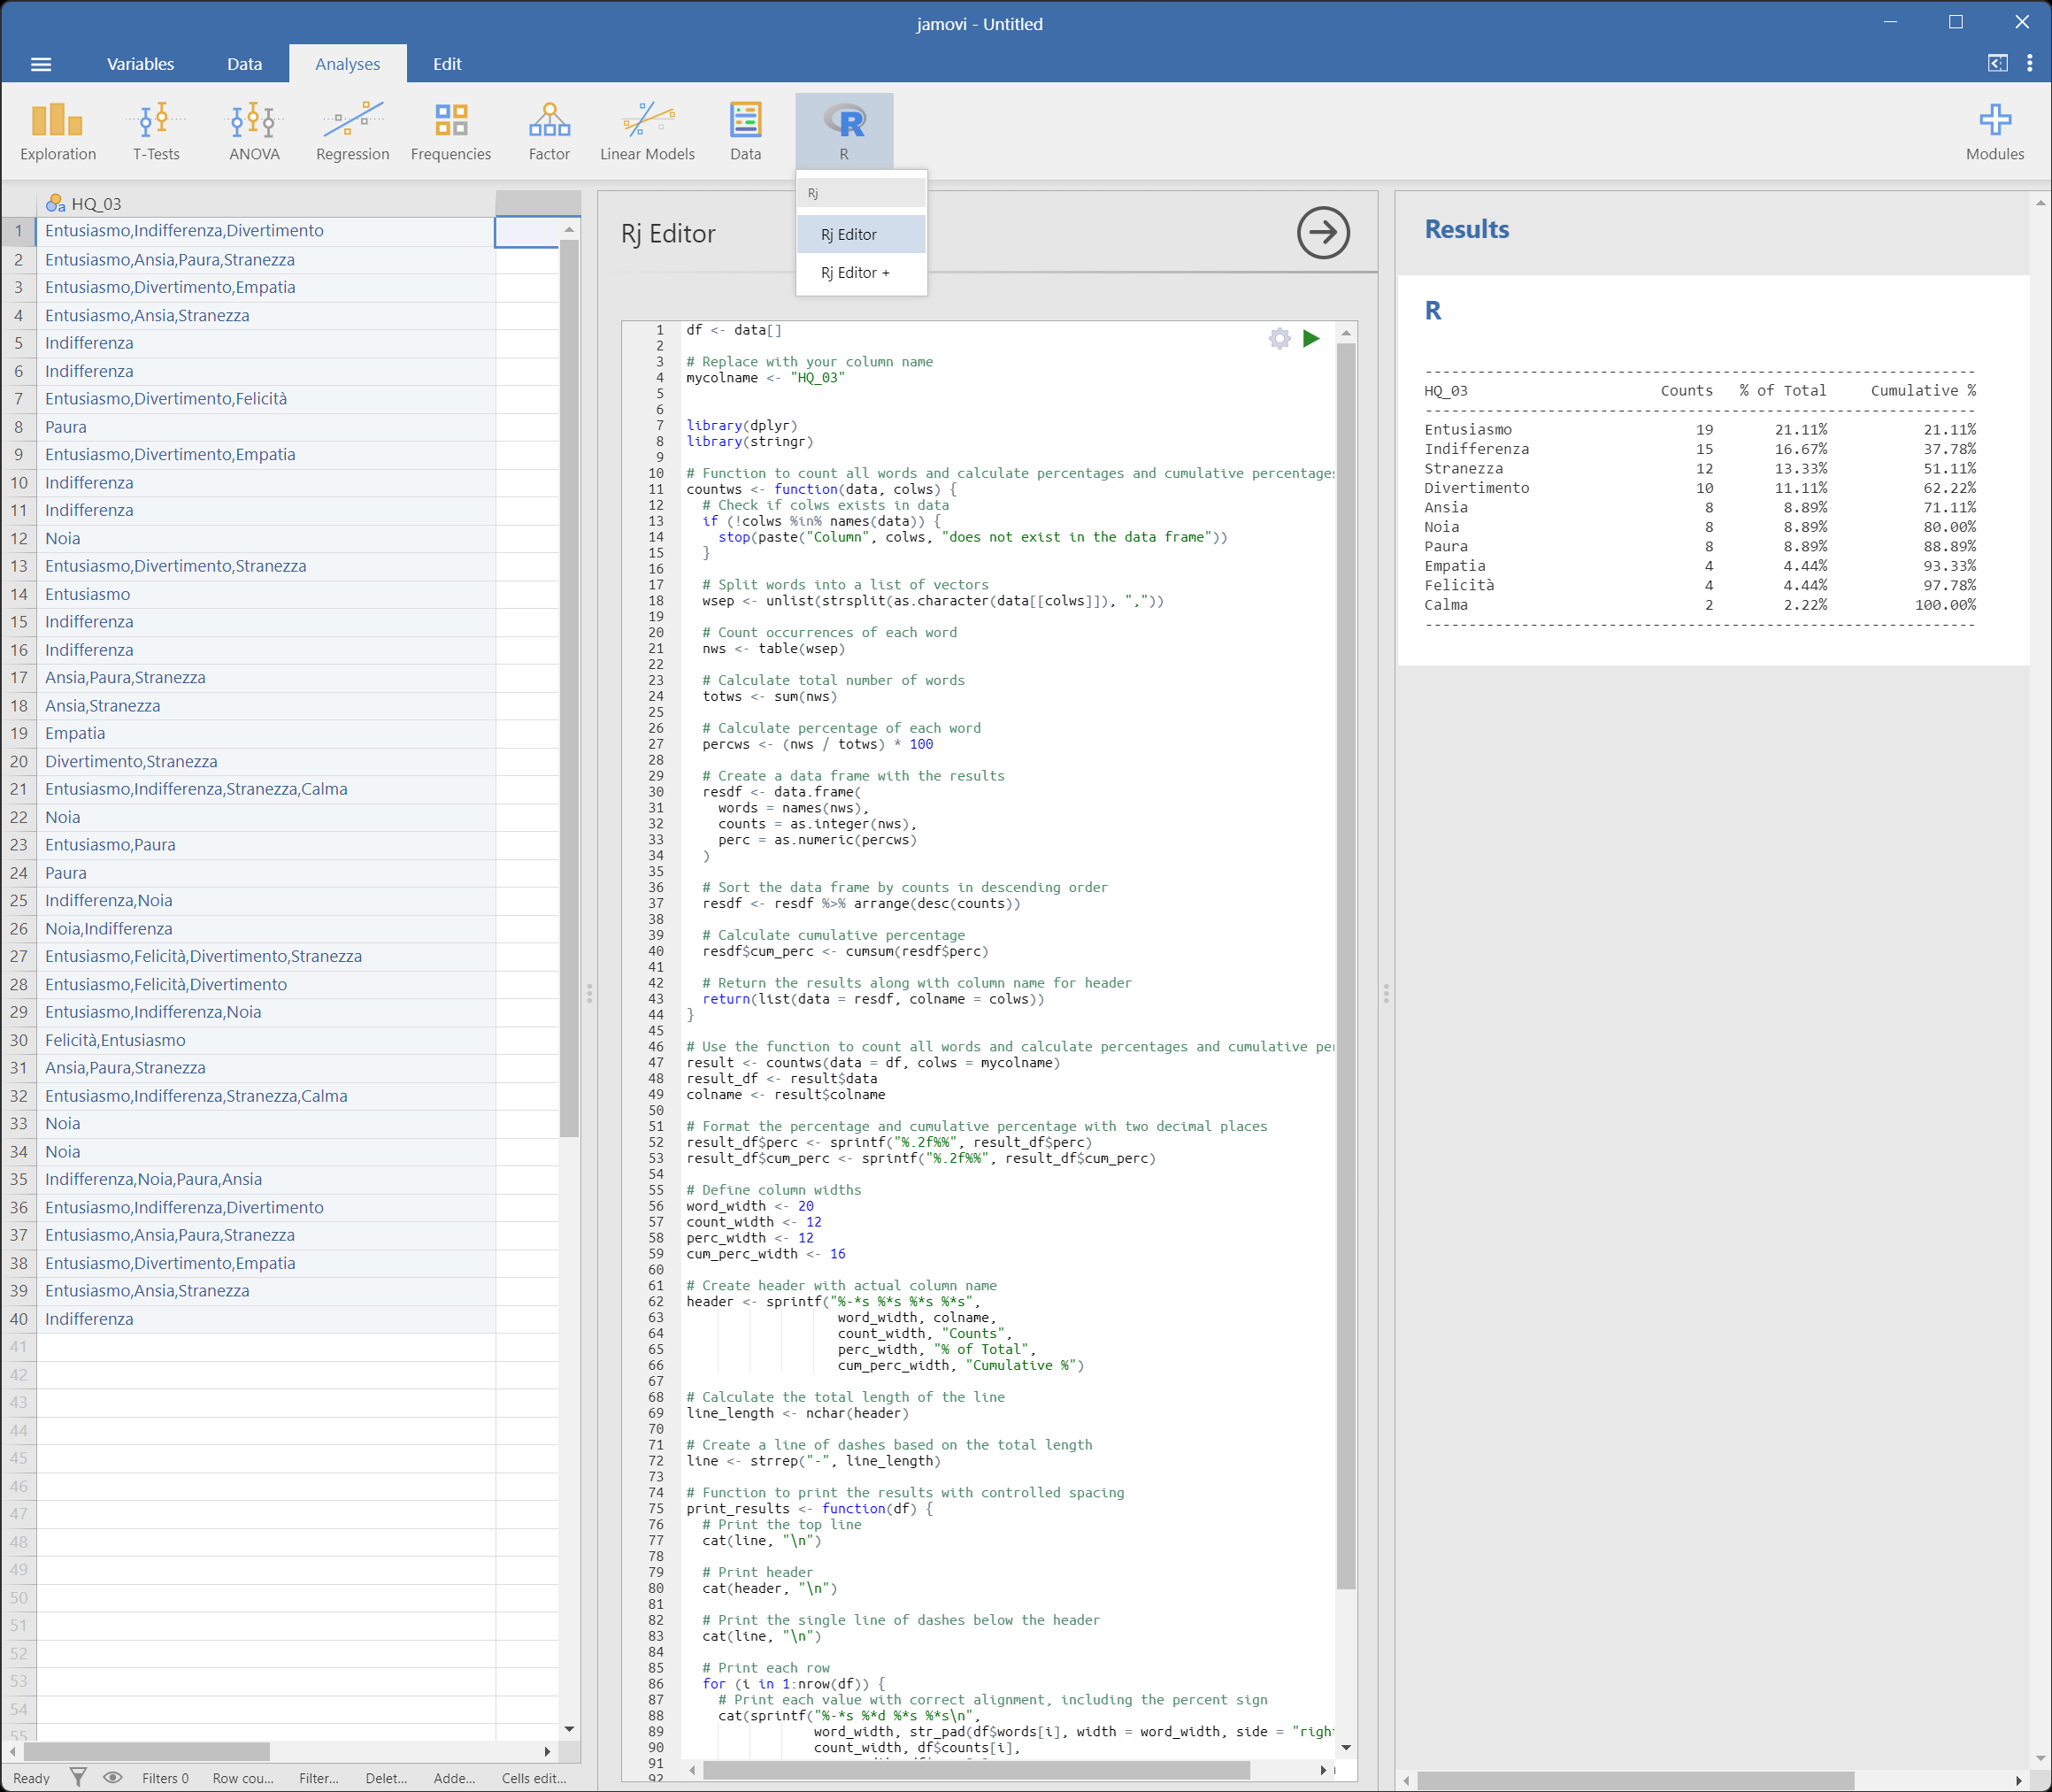
- Rj_example.png (329.52 KiB) Viewed 25067 times
In the example there is a worksheet with a single column and a few cases (hot and laziness), which could represent your variable of interest.
I put the same name as your variable, but if you have a different name to try, in the R script you can replace the one I used (4th line of the R script).
Cheers,
Maurizio
https://www.jamovi.org/about.html