Page 1 of 2
Composite boxplots
Posted: Sat Nov 15, 2025 3:38 pm
by carlosferreira
Is there a way to combine more than one variable in the same blot, while spliting it according to a spefic criteria?
For example (see attachment) I would like to combine in a single boxplot all the dimensions
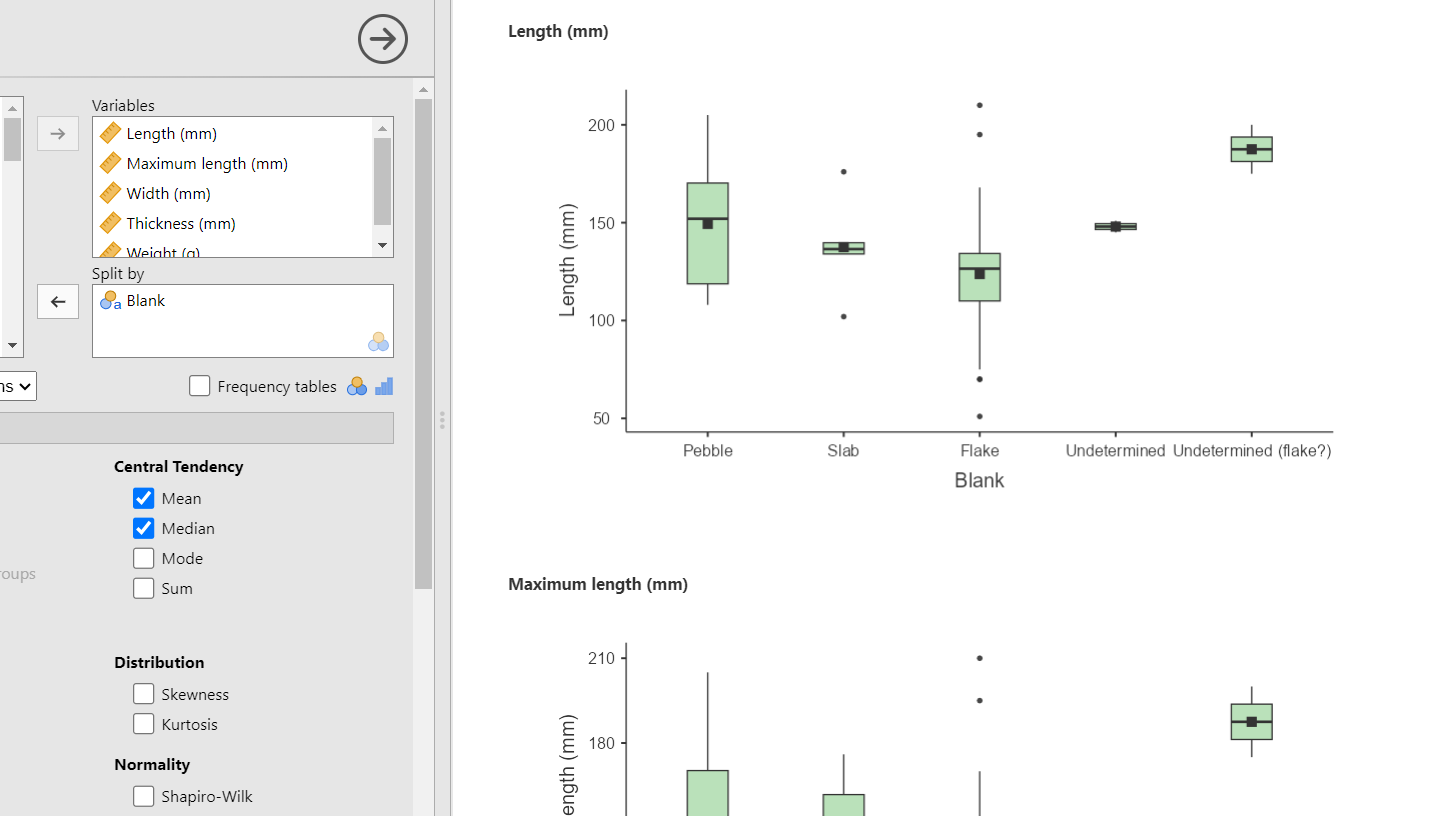
- Attachment 1 - jamovi
- imagem_2025-11-15_153455394.png (60.62 KiB) Viewed 83157 times
, as in the example from other Software (see attachment 2)
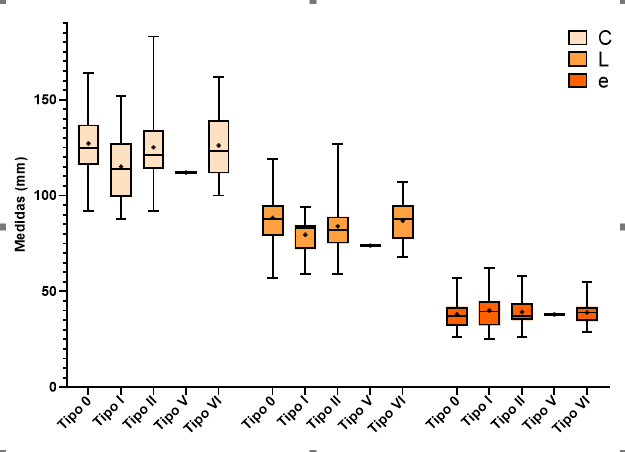
- Attachment 2 - other
- imagem_2025-11-15_153744691.png (13.15 KiB) Viewed 83157 times
Thanks in advance
Re: Composite boxplots
Posted: Sat Nov 15, 2025 8:53 pm
by seol
Hi
Is this what you want shown below?
Best
Seol
Re: Composite boxplots
Posted: Sat Nov 15, 2025 8:59 pm
by seol
You can create this type of composite boxplot in snowLatent → Profile plot.
The Profile plot module allows you to place multiple continuous variables in a single figure, with
– variables on the x-axis,
– values on the y-axis, and
– grouping shown by color.
This produces exactly the combined boxplot layout shown in your second example.
Re: Composite boxplots
Posted: Sat Nov 15, 2025 9:17 pm
by carlosferreira
Thank you very much for your comment.
It's something like that yes.
But I don't see that option in my version (2.6.44). How do I find snowLatent?
Best regards,
Carlos
Re: Composite boxplots
Posted: Sat Nov 15, 2025 9:24 pm
by carlosferreira
I have found it, but it appears this error
Re: Composite boxplots
Posted: Sun Nov 16, 2025 12:17 am
by seol
This error occurs because your selected variables contain missing or infinite values; please remove or clean these values and the Profile plot will work correctly.
Re: Composite boxplots
Posted: Sun Nov 16, 2025 10:03 am
by carlosferreira
Thanks.
Just another question. Is there a way to mark the mean value on this boxplots?
Re: Composite boxplots
Posted: Sun Nov 16, 2025 8:48 pm
by seol
Not yet. Todo list.
Re: Composite boxplots
Posted: Mon Nov 17, 2025 9:05 am
by carlosferreira
Thank you very much for the help. Looking forward to it!
Re: Composite boxplots
Posted: Wed Nov 19, 2025 7:34 pm
by carlosferreira
And is there a way to command that 4 variables are shown in the same plot and not in different plots? That would also be very useful