Page 1 of 1
Getting data from RJeditor back to the jamovi dataset
Posted: Thu Dec 13, 2018 9:27 pm
by Shabd
Hi,
I love the RJ editor feature very much (you guys are doing a great job!), but I have one important question related to it:
It seems currently impossible to get data that was created in the RJeditor "system R sandbox" back to the Jamovi dataset. E.g. if i do:
data <-cbind(data, new_column)
...and then do:
descriptives (data)
... I can see the newly created column in the output, however, the new column is not appearing in the jamovi spreadsheet and hence cannot be saved with it.
Am I right that this is still impossible right now?
And if so, do you have a quick workaround how to make this work?
Such a function would be useful since I plan to do a simple statistic course with jamovi. Students will have no idea of R but in one course module might want to use some R-packages with functions that jamovi does not provide (like, e,g, poLCA) and take the generated data (e.g. class assignment) "back to jamovi" in order to do simple analyses with it there.
Any idea to achieve this in a very easy way?
Thanks a lot in advance, cheers,
Shabd
Re: Getting data from RJeditor back to the jamovi dataset
Posted: Thu Dec 13, 2018 10:51 pm
by jonathon
hi shabd,
you're right, this is a limitation of jamovi (and Rj) at this time.
as a work around, you can generate a stream of text values, and paste them into a column in jamovi:
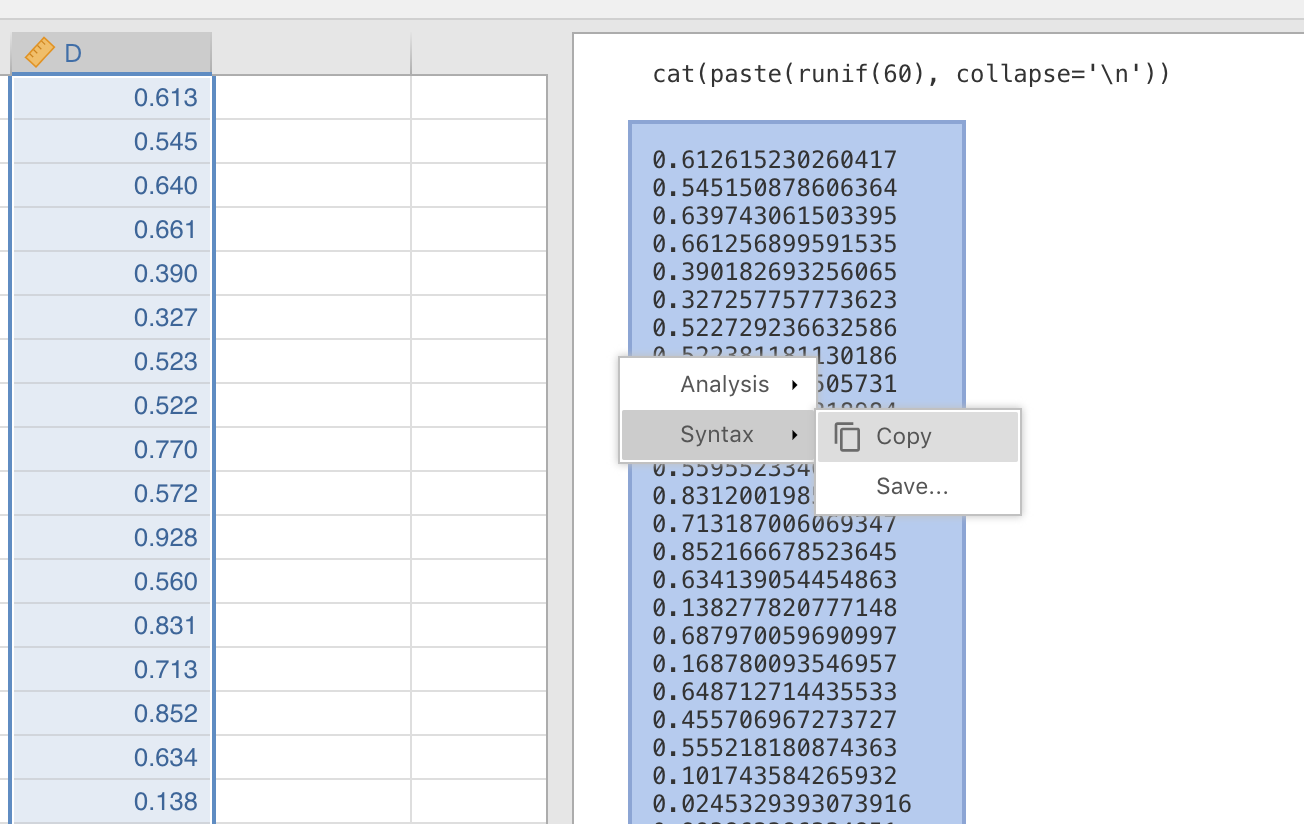
- Screen Shot 2018-12-14 at 09.49.09.png (225.25 KiB) Viewed 88130 times
what you copy/paste from the results (i notice) starts with a blank line, and pasting this doesn't work, so you have to paste the values into something like notepad, *then* copy all the values (skipping the first line), before you can paste those into a column in jamovi.
i'll fix this issue shortly.
jonathon
Re: Getting data from RJeditor back to the jamovi dataset
Posted: Fri Mar 18, 2022 7:20 pm
by credmontgo
Updates here, or better way?
Re: Getting data from RJeditor back to the jamovi dataset
Posted: Sat Apr 09, 2022 12:27 pm
by RHainez
+1 on this feature
Re: Getting data from RJeditor back to the jamovi dataset
Posted: Mon Apr 11, 2022 1:17 am
by jonathon
my plan is to have this sometime in june
jonathon
Re: Getting data from RJeditor back to the jamovi dataset
Posted: Mon Aug 26, 2024 4:11 am
by DeborahA
Is there any update on this? I have some students using some code I wrote a while ago to calculate Mahalanobis Distance, and they want to get the data back into the dataset.
Thanks!
Deborah.
Re: Getting data from RJeditor back to the jamovi dataset
Posted: Mon Aug 26, 2024 6:09 am
by jonathon
hi, yes, if you use the Rj Editor+, you can do things like:
data <- cbind(data, values)
and it will be added into the data set.
Re: Getting data from RJeditor back to the jamovi dataset
Posted: Mon Aug 26, 2024 10:44 pm
by MAgojam
Hey Deborah,
take a look at the screenshot, you might be interested in using Rj Editor+
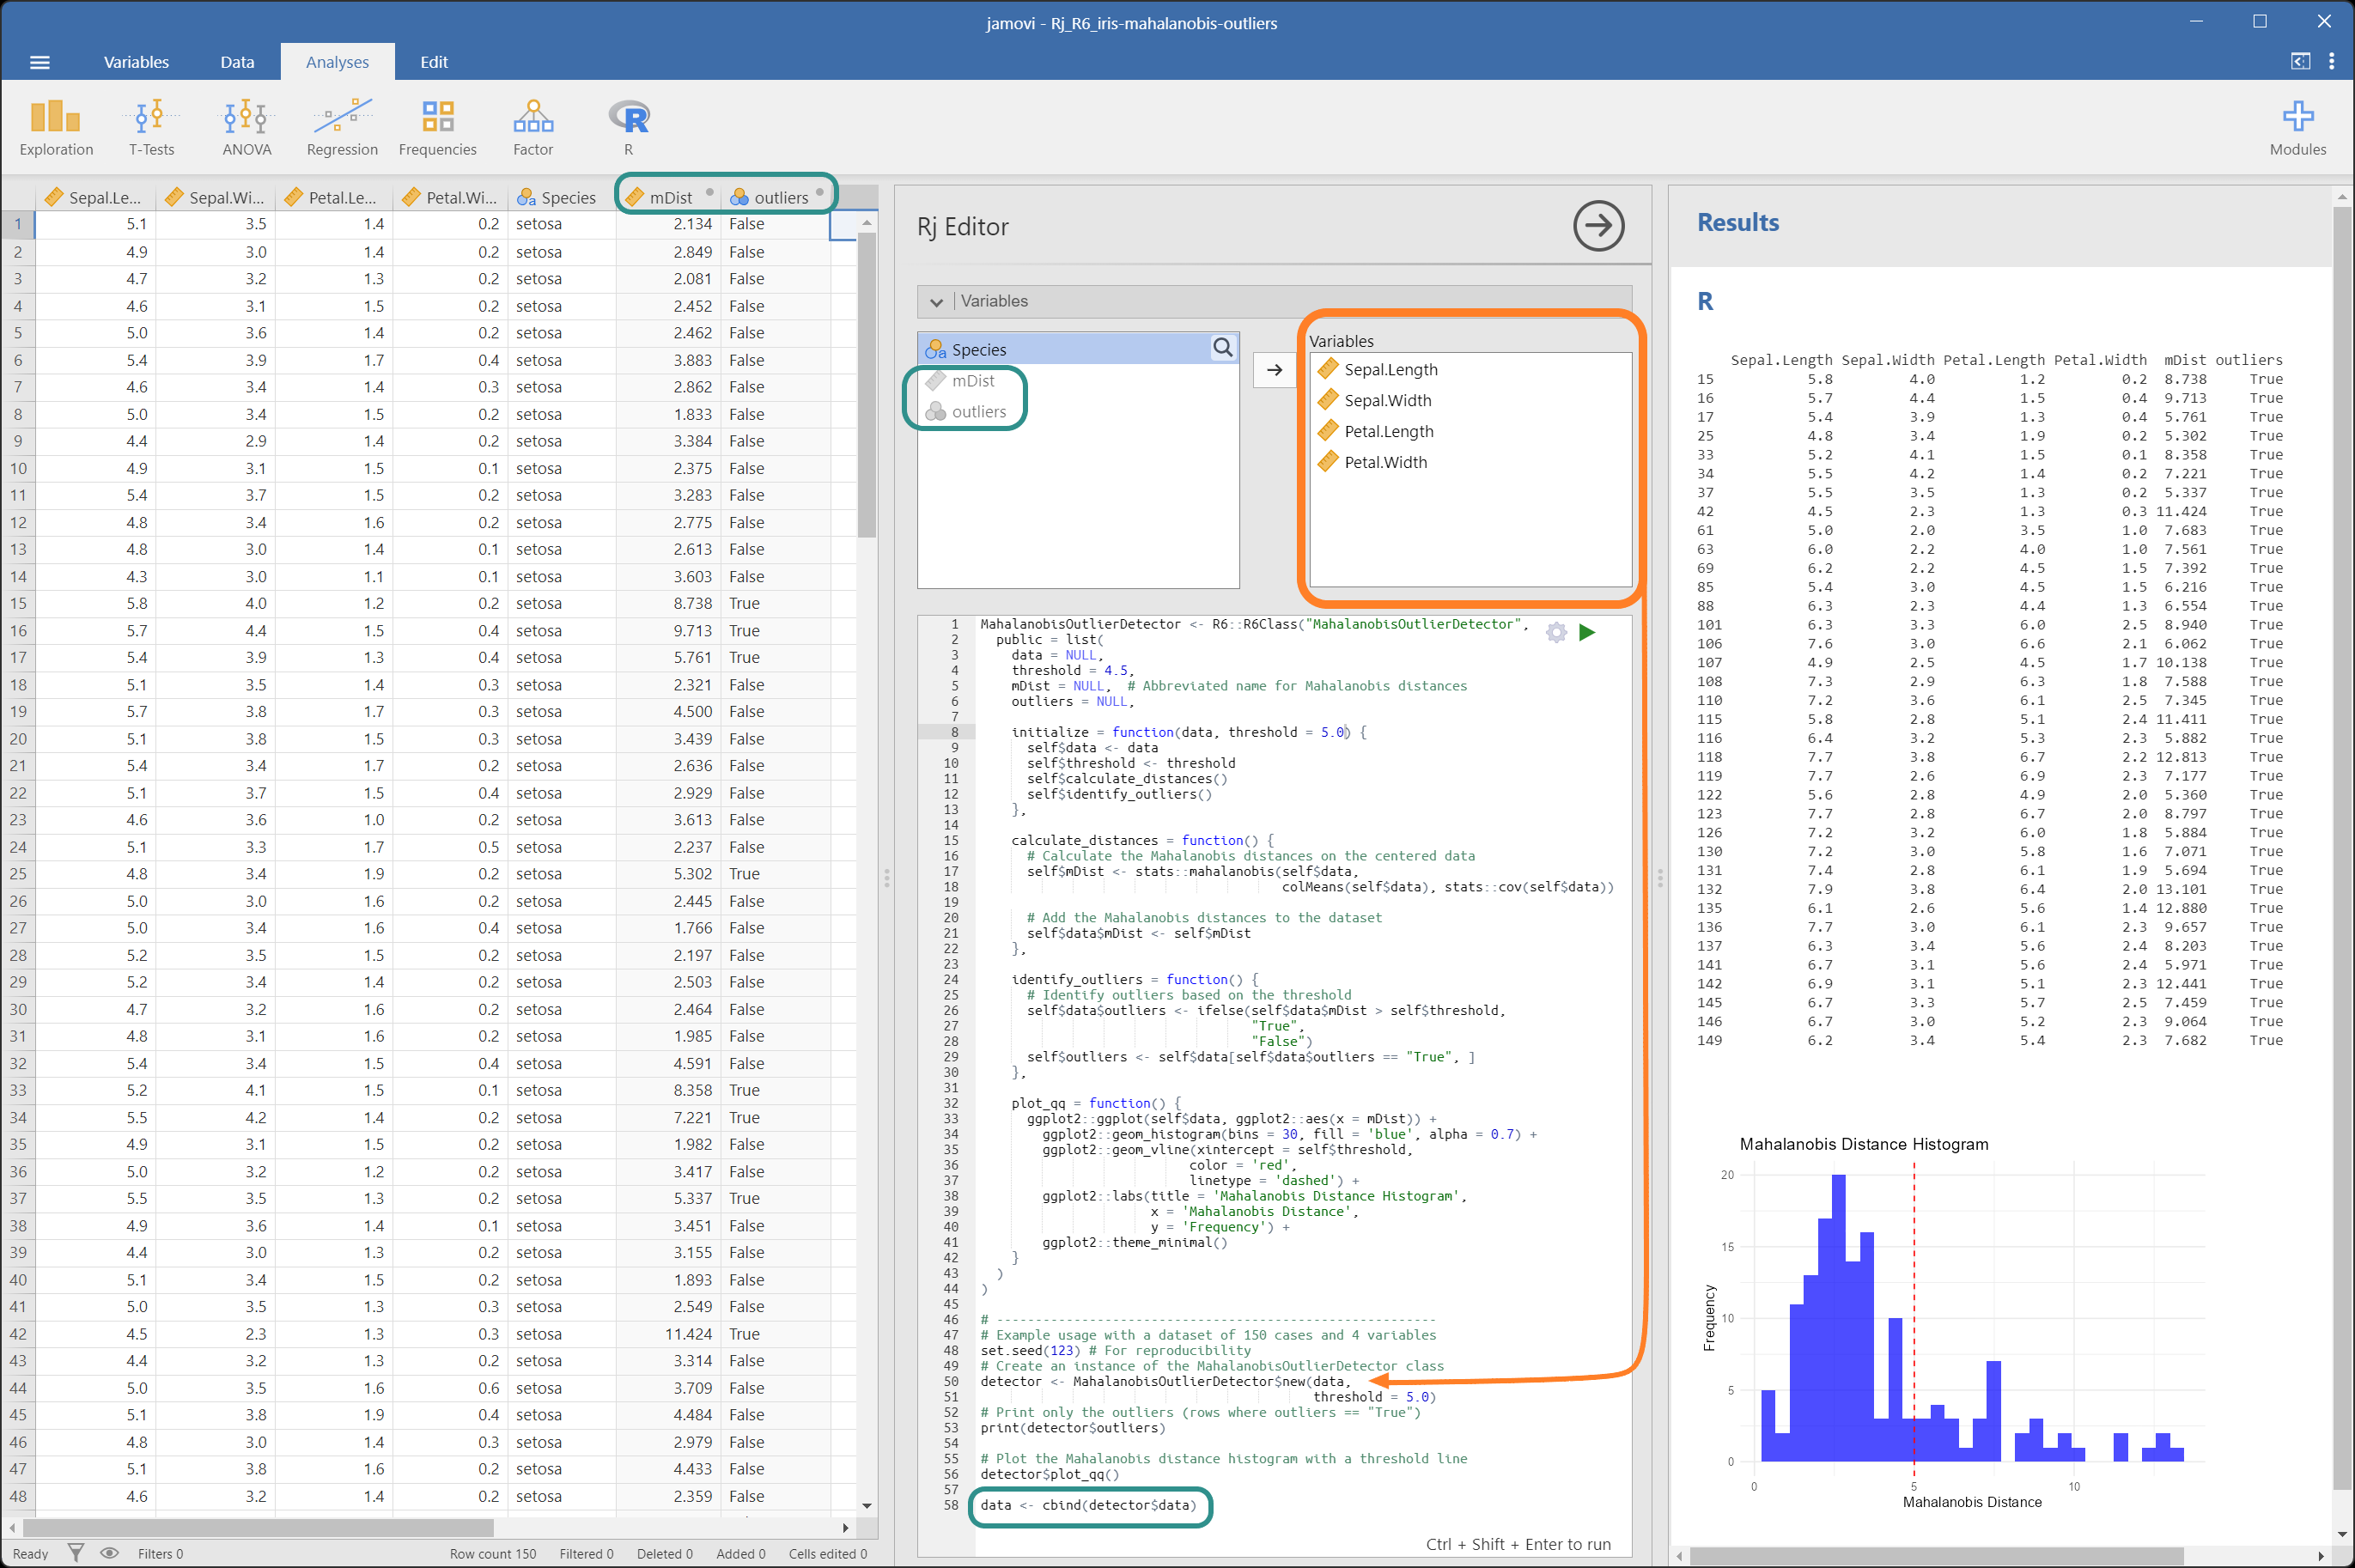
- Rj Editor+ Mahalanobis.png (449.78 KiB) Viewed 82971 times
with this code:
Code: Select all
MahalanobisOutlierDetector <- R6::R6Class("MahalanobisOutlierDetector",
  public = list(
    data = NULL,
    threshold = 5.0,
    mDist = NULL,  # Abbreviated name for Mahalanobis distances
    outliers = NULL,

    initialize = function(data, threshold = 5.0) {
      self$data <- data
      self$threshold <- threshold
      self$calculate_distances()
      self$identify_outliers()
    },

    calculate_distances = function() {
      # Calculate the Mahalanobis distances on the centered data
      self$mDist <- stats::mahalanobis(self$data,
                                       colMeans(self$data), stats::cov(self$data))

      # Add the Mahalanobis distances to the dataset
      self$data$mDist <- self$mDist
    },

    identify_outliers = function() {
      # Identify outliers based on the threshold
      self$data$outliers <- ifelse(self$data$mDist > self$threshold,
                                   "True",
                                   "False")
      self$outliers <- self$data[self$data$outliers == "True", ]
    },

    plot_qq = function() {
      ggplot2::ggplot(self$data, ggplot2::aes(x = mDist)) +
        ggplot2::geom_histogram(bins = 30, fill = 'blue', alpha = 0.7) +
        ggplot2::geom_vline(xintercept = self$threshold,
                           color = 'red',
                           linetype = 'dashed') +
        ggplot2::labs(title = 'Mahalanobis Distance Histogram',
                      x = 'Mahalanobis Distance',
                      y = 'Frequency') +
        ggplot2::theme_minimal()
    }
  )
)

# ---------------------------------------------------------
# Example usage with a dataset of 150 cases and 4 variables
set.seed(123) # For reproducibility
# Create an instance of the MahalanobisOutlierDetector class
detector <- MahalanobisOutlierDetector$new(data,
                                           threshold = 5.0)
# Print only the outliers (rows where outliers == "True")
print(detector$outliers)

# Plot the Mahalanobis distance histogram with a threshold line
detector$plot_qq()

data <- cbind(detector$data)
Cheers,
Maurizio
https://www.jamovi.org/about.html