Hello guys
This is the code that I used:
To clarify:
Volumen = name of the dataset that I used
Responder = name of the response variable (0 or 1)
CVP, PPV, PCWP, SVV = predictor variables (continuous)
rocCVP <- roc (Volumen$Responder, Volumen$CVP, percent = TRUE)
rocPPV <- roc (Volumen$Responder, Volumen$PPV, percent = TRUE)
rocPCWP <- roc (Volumen$Responder, Volumen$PCWP, percent = TRUE)
rocSVV <- roc (Volumen$Responder, Volumen$SVV, percent = TRUE)
ciCVP <- ci(rocCVP, of = "se", sp = seq(0, 100, 5), boot.n=10000)
ciPPV <- ci(rocPPV, of = "se", sp = seq(0, 100, 5), boot.n=10000)
ciPCWP <- ci(rocPPV, of = "se", sp = seq(0, 100, 5), boot.n=10000)
ciSVV <- ci(rocPPV, of = "se", sp = seq(0, 100, 5), boot.n=10000)
rtest <- roc.test(rocCVP, rocPPV, boot.n=10000)
rtest1 <- roc.test(rocCVP, rocPCWP, boot.n=10000)
rtest2 <- roc.test(rocCVP, rocSVV, boot.n=10000)
rtest3 <- roc.test(rocPPV, rocPCWP, boot.n=10000)
pdf("Volume responder.pdf", width=10, height=10)
plot(rocCVP, col="#FF0000", lty=1, lwd=2, print.auc=TRUE, print.auc.y=56)
plot(rocPPV, col="#0000FF", add=TRUE, lty=2, lwd=2, print.auc=TRUE, print.auc.y=50)
plot(rocPCWP, col="#00FF00", add=TRUE, lty=3, lwd=2, print.auc=TRUE, print.auc.y=44)
plot(rocSVV, col="#FFAA00", add=TRUE, lty=4, lwd=2, print.auc=TRUE, print.auc.y=38)
text(18, 50, sprintf("CVP/PPV p = %.3f", rtest$p.value), adj=c(0,1))
text(18, 48, sprintf("CVP/PCWP p = %.3f", rtest1$p.value), adj=c(0,1))
text(18, 46, sprintf("CVP/SVV p = %.3f", rtest2$p.value), adj=c(0,1))
text(18, 44, sprintf("PPV/PCWP p = %.3f", rtest3$p.value), adj=c(0,1))
lines(c(20, 20), c(50, 41), lwd=1.5)
legend("bottomright", legend=c("CVP", "PPV", "PCWP", "SVV"), col=c("#FF0000", "#0000FF", "#00FF00", "#FFFF00"), lwd=2)
dev.off()
The resulting plot looks like this:
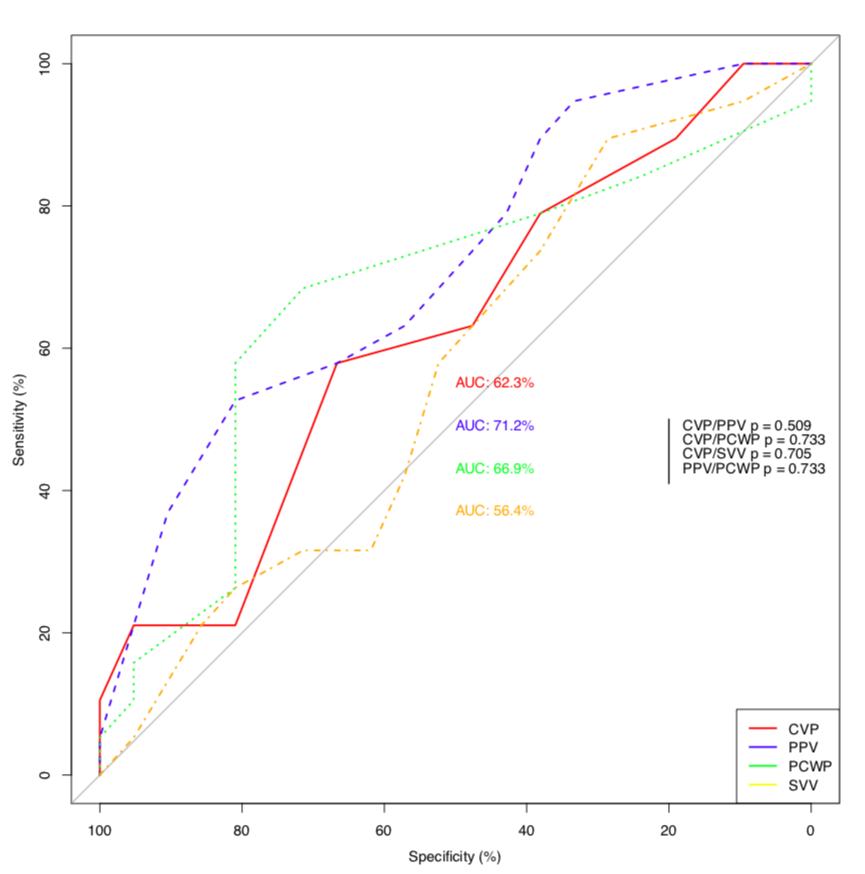
- Slika zaslona 2019-09-07 u 14.36.05.png (108 KiB) Viewed 30673 times